Istio 연습과제 - telemetry - collect metrics & logs on minikube
kubernetes 1.14.0, Istio 1.1.1, minikube v1.0.0 , macOS Mojave 10.14.4(18E226)
Istio에서 telemetry metric, 수집하는 handler, metric 과 handler를 연결하는 rule 정의를 통하여 telemetry 데이터를 수집하고 grafana를 통해 그 결과를 조회해 봅니다.
준비작업
- minikube 준비
$ minikube start --cpus 4 --memory 8192 -p istio-telemetry
- Helm 설치 및 초기화
$ brew install kubernetes-helm
$ helm init
- Istio 초기화 (namespace, CRDs)
$ wget https://github.com/istio/istio/releases/download/1.1.1/istio-1.1.1-osx.tar.gz
$ tar -vxzf istio-1.1.1-osx.tar.gz
$ cd istio-1.1.1
$ kubectl create namespace istio-system
$ helm template install/kubernetes/helm/istio-init --name istio-init --namespace istio-system | kubectl apply -f -
- Istio 설치
$ helm template install/kubernetes/helm/istio --name istio --namespace istio-system \
| kubectl apply -f -
- Istio 파드 정상상태 확인
$ kubectl get pod -n istio-system
- Istio-system 파드 정상상태로 구성되었다면 BookInfo 어플 설치 및 확인
$ kubectl apply -f <(istioctl kube-inject -f samples/bookinfo/platform/kube/bookinfo.yaml)
$ kubectl get pod
- Istio ingress gateway 환경변수
GW_URL정의
$ export GW_URL=http://$(minikube ip -p istio-trace):$(kubectl -n istio-system get service istio-ingressgateway -o jsonpath='{.spec.ports[?(@.name=="http2")].nodePort}')
Metrics
Collect Matrics
이 TASK는 Metrics 를 커스트마이징하고 수집하기위해 Istio 구성을 어떻게 하는지를 보여줍니다.
- Monitoring Microservices with Istio
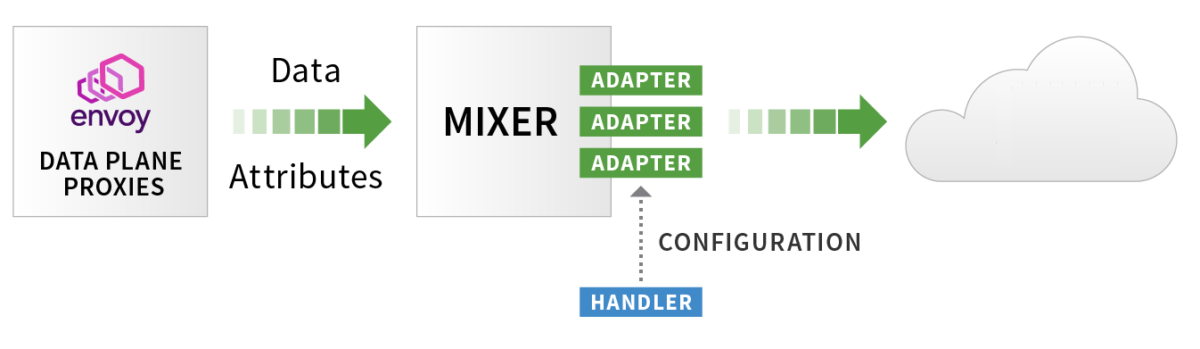
- 마이크로서비스간 트래픽에 따른 Envoy Sidecar가 Proxy를 통해 얻은 데이터 속성들을 Mixer가 Telemetry-backend(Prometheus, Fluentd 등) 로 전달

- Matric(Instance), Handler, Rule 정의를 통한 Istio Collect Metrics 구조
- 마이크로서비스간 트래픽에 따른 Envoy Sidecar가 Proxy를 통해 얻은 데이터 속성들을 Mixer가 Telemetry-backend(Prometheus, Fluentd 등) 로 전달
- Mixer가 Mesh내 모든 트래픽에 대한 레포트와 메트릭을 자동으로 생성하도록 구성
- 3가지 Mixer의 기능을 컨트롤하도록 구성을 추가
- kind : metric - Istion 속성으로부터 instance 구성
- kind : prometheus - 생성된 instance_를 처리할 수 있는 Prometheus _handler 구성
- kind : rule - instance 를 Prometheus handler 에게 보내는 규칙 지정
$ kubectl apply -f - <<EOF
apiVersion: "config.istio.io/v1alpha2"
kind: metric
metadata:
  name: doublerequestcount
  namespace: istio-system
spec:
  value: "2" # count each request twice
  dimensions:
    reporter: conditional((context.reporter.kind | "inbound") == "outbound", "client", "server")
    source: source.workload.name | "unknown"
    destination: destination.workload.name | "unknown"
    message: '"twice the fun!"'
  monitored_resource_type: '"UNSPECIFIED"'
---
apiVersion: "config.istio.io/v1alpha2"
kind: prometheus
metadata:
  name: doublehandler
  namespace: istio-system
spec:
  metrics:
  - name: double_request_count # Prometheus metric name
    instance_name: doublerequestcount.metric.istio-system # Mixer instance name (fully-qualified)
    kind: COUNTER
    label_names:
    - reporter
    - source
    - destination
    - message
---
apiVersion: "config.istio.io/v1alpha2"
kind: rule
metadata:
  name: doubleprom
  namespace: istio-system
spec:
  actions:
  - handler: doublehandler.prometheus
    instances:
    - doublerequestcount.metric
EOF
- Metrics가 정상 수집되는지 확인을 위해 BookInfo 서비스로 트래픽 발생
$ curl -I $GW_URL/productpage
- Prometheus 포트 포워딩
$ kubectl -n istio-system port-forward $(kubectl -n istio-system get pod -l app=prometheus -o jsonpath='{.items[0].metadata.name}') 9090:9090
- 결과 확인
- 브라우저에서 http://localhost:9090 을 열고 입력박스에
istio_double_request_count를 입력하고 “Execute” 버튼 클릭 - /productpage 페이지가 호출될 때마다 카운트가 2개씩 증가함을 확인한다.
- 브라우저에서 http://localhost:9090 을 열고 입력박스에
Prometheus로 부터 Metrics 조회
이 TASK는 Prometheus를 활용하여 Istio Metrics 를 어떻게 조회하는를 보여줍니다.
- Promethus URL 에서 Query에 아래 항목을 입력하고 “Execute” 버튼 클릭
istio_requests_total: request 전체istio_requests_total{destination_service="productpage.default.svc.cluster.local"}: productpages 요청수istio_requests_total{destination_service="reviews.default.svc.cluster.local", destination_version="v3"}: reviews 의 v3 요청 수rate(istio_requests_total{destination_service=~"productpage.*", response_code="200"}[5m]): 모든 productpage 서비스 5분마다 요청 비율productpage service
Visualizing Metrics with Grafana
이 TASK는 서비스 메시내의 트래픽 모니터링을 위해 Grafana Dashboard 를 어떻게 구성하고 사용하는지를 보여줍니다.
- grafana 사용 옵션 추가하여 istio 재구성
$ helm template install/kubernetes/helm/istio --name istio --namespace istio-system \
--set grafana.enabled=true \
| kubectl apply -f -
- Istio 파드 정상상태 및 grafana 가 구성되었는지 확인
$ kubectl get pod -n istio-system
- productpage 트래픽 발생한다
$ curl -I $GW_URL/productpage
- Grafana 포트 포워딩
$ kubectl -n istio-system port-forward $(kubectl -n istio-system get pod -l app=grafana -o jsonpath='{.items[0].metadata.name}') 3000:3000
- 결과확인
- 브라우저에서 http://localhost:3000/dashboard/db/istio-mesh-dashboard 을 오픈
- 트래픽 발생하면 잠시 후 Grafana Dashboard 에 반영되는 것을 확인
- Istio Dashboard : Mesh, Mixer, Service, Performance, Pilot, Service, Workload, Gally
Logs
로그 수집
이 TASK는 로그를 커스트마이징하고 수집하기위해 Istion 구성을 어떻게 하는지를 보여줍니다.
-
메시내 모든 트래픽에 대해서 로그 스트림이 자동으로 생성되고 수집되도록 설정
- kind: logentry : Istio 속성들로부터 instances 구성
- kind: stdio : 구성된 instances 처리 handlers 생성
- kind: rule : handlers 에게 _instances_를 보내는 규칙(매칭조건) 지정
-
configDefaultNamespace=istio-system옵션 지정하여 Istio 재구성
$ helm template install/kubernetes/helm/istio --name istio --namespace istio-system \
--set configDefaultNamespace=istio-system \
| kubectl apply -f -
$ kubectl apply -f - <<EOF
apiVersion: "config.istio.io/v1alpha2"
kind: logentry
metadata:
  name: newlog
  namespace: istio-system
spec:
  severity: '"warning"'
  timestamp: request.time
  variables:
    source: source.labels["app"] | source.workload.name | "unknown"
    user: source.user | "unknown"
    destination: destination.labels["app"] | destination.workload.name | "unknown"
    responseCode: response.code | 0
    responseSize: response.size | 0
    latency: response.duration | "0ms"
  monitored_resource_type: '"UNSPECIFIED"'
---
apiVersion: "config.istio.io/v1alpha2"
kind: stdio
metadata:
  name: newhandler
  namespace: istio-system
spec:
 severity_levels:
   warning: 1 # Params.Level.WARNING
 outputAsJson: true
---
apiVersion: "config.istio.io/v1alpha2"
kind: rule
metadata:
  name: newlogstdio
  namespace: istio-system
spec:
  match: "true" # match for all requests
  actions:
   - handler: newhandler.stdio
     instances:
     - newlog.logentry
EOF
- /productpage 트래픽 발생
$ curl -I $GW_URL/productpage
- istio-telemetry 파드 로그 검색하여 3개 로그가 조회됨을 확인
$ kubectl logs -n istio-system -l istio-mixer-type=telemetry -c mixer \
| grep \"instance\":\"newlog.logentry.istio-system\" \
| grep -v '"destination":"telemetry"' \
| grep -v '"destination":"pilot"' \
| grep -v '"destination":"policy"' \
| grep -v '"destination":"unknown"'
- logentry의 variables 반경하고 destination service 이름이 “details”만 로깅 되도록 rule 을 변경
$ kubectl apply -f - <<EOF
apiVersion: "config.istio.io/v1alpha2"
kind: logentry
metadata:
  name: newlog
  namespace: istio-system
spec:
  severity: '"warning"'
  timestamp: request.time
  variables:
    service: destination.service.name | "unknown"
    latency: response.duration | "0ms"
  monitored_resource_type: '"UNSPECIFIED"'
---
apiVersion: "config.istio.io/v1alpha2"
kind: rule
metadata:
  name: newlogstdio
  namespace: istio-system
spec:
  match: destination.service.name=="details"
  actions:
   - handler: newhandler.stdio
     instances:
     - newlog.logentry
EOF
- /productpage 트래픽 발생
$ curl -I $GW_URL/productpage
- istio-telemetry 파드 로그 검색하여 줄어든 속성으로 로그가 3개가 아닌 2개(app=details)만 조회됨을 확인
$ kubectl logs -n istio-system -l istio-mixer-type=telemetry -c mixer \
| grep \"instance\":\"newlog.logentry.istio-system\" \
| grep -v '"destination":"telemetry"' \
| grep -v '"destination":"pilot"' \
| grep -v '"destination":"policy"' \
| grep -v '"destination":"unknown"'
Getting Envoy’s Access Logs
이 TASK는 Envoy 의 엑세스로그를 standard output 출력을 어떻게 구성하는지 보여줍니다.
- sleep, httpbin 샘플 설치 및 실행여부 확인
$ kubectl apply -f <(istioctl kube-inject -f samples/sleep/sleep.yaml)
$ kubectl apply -f <(istioctl kube-inject -f samples/httpbin/httpbin.yaml)
$ kubectl get pod
global.proxy.accessLogFile옵션 추가하여 istio 재구성
$ helm template install/kubernetes/helm/istio --name istio --namespace istio-system \
--set configDefaultNamespace=istio-system \
--set global.proxy.accessLogFile="/dev/stdout"  \
| kubectl apply -f -
- sleep 에서 httpbin 로 요청 “teapot” 결과 나오는지 확인
$ kubectl exec -it $(kubectl get pod -l app=sleep -o jsonpath={.items..metadata.name}) -c sleep -- curl -v httpbin:8000/status/418
- sleep 과 httpbin 로그 마지막 줄에 “GET /status/418 HTTP/1.1” 418 “ 조회되는지 확인
$ kubectl logs -l app=sleep -c istio-proxy -f
$ kubectl logs -l app=httpbin -c istio-proxy -f
- 비교를 위해
global.proxy.accessLogFile옵션에 공백값을 주어 istio 재구성
$ helm template install/kubernetes/helm/istio --name istio --namespace istio-system \
--set configDefaultNamespace=istio-system \
--set global.proxy.accessLogFile=""  \
| kubectl apply -f -
- sleep 에서 httpbin 로 요청 “teapot” 결과 나오는지 확인하고 각각의 로그에서 Access 로그가 추가되지 않았음을 확인
$ kubectl exec -it $(kubectl get pod -l app=sleep -o jsonpath={.items..metadata.name}) -c sleep -- curl -v httpbin:8000/status/418
posted at 2019/04/17 13:15 